Sometimes it seems like it was just yesterday that the World Health Organization (WHO) declared COVID-19 a pandemic. But it was five years ago — March 11, 2024 — that we started to quarantine ourselves and adopt extra protection and hygiene measures. To mark the date, The New York Times shows in 30 graphs how the US has changed in the meantime. This edition of our Top 10 in Data Journalism, which considered stories between March 8 and 21, also highlights an ESPN report on the 75th anniversary of Formula 1 motor racing; a visual narrative from Nikkei on the 30th anniversary of the sarin gas attack on the Tokyo subway; an Al Jazeera special feature on how Ramadan works in countries with opposite time zones; and a statistical tool from FlowData on the grim science of predicting when a person will die.
COVID-19 Pandemic’s Legacy, Five Years On
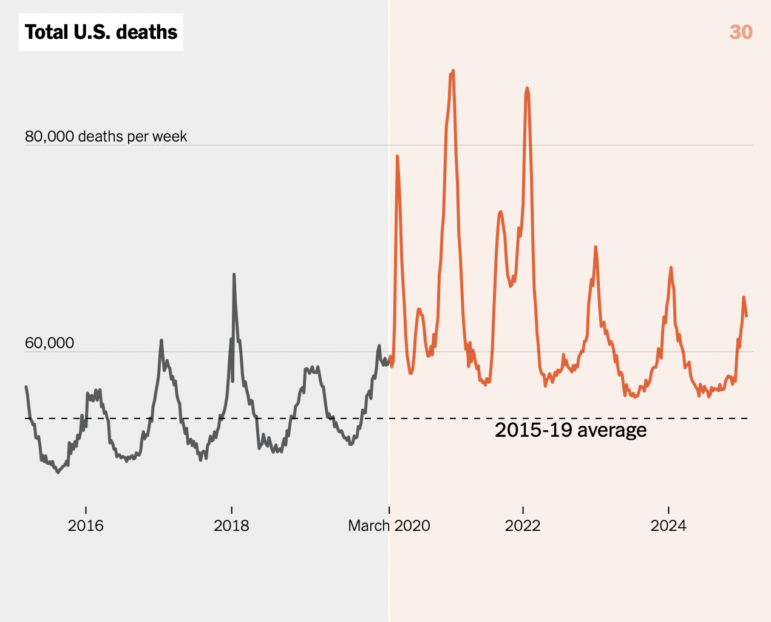
Image: Screenshot, The New York Times
On March 11, 2020, the WHO declared COVID-19 — an acute respiratory infection caused by the highly transmissible and often fatal coronavirus SARS-CoV-2 — a pandemic. As The New York Times noted, decades from now the pandemic’s imprint will still be visible in historical data for almost everything that can be measured, whether as a spike or a sharp decline. In this special report, the newspaper presents a series of graphs that capture these sharp changes and wide-ranging impact that COVID-19 has had in the United States, from the number of unemployment claims to Google searches for how to cut your own hair — both have seen dramatic increases — to those indicators that have seen sharp declines, such as time spent socializing with others, public transportation travel, and even money spent on food. Finally, the saddest graph: the total number of deaths in the US, which had the highest number of lives lost in the world.
Trump’s Tariff War Continues
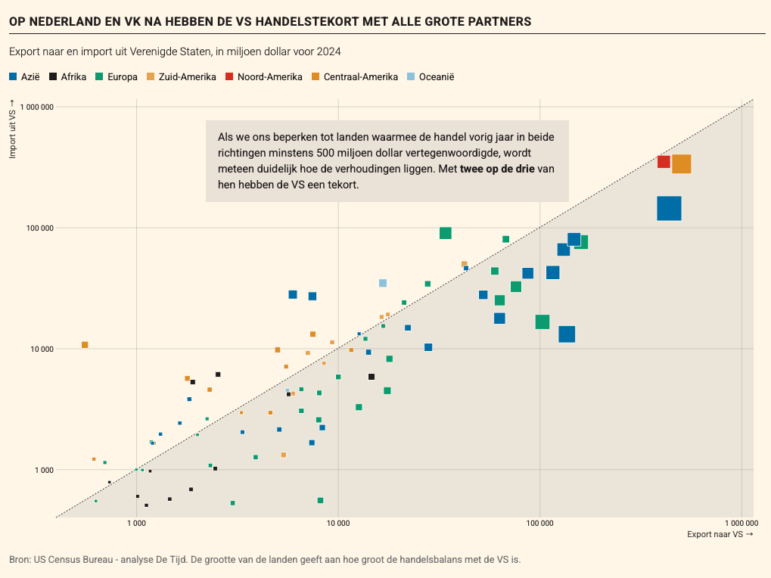
In two out of three countries, the US runs a trade deficit (represented by boxes below the slanted line). Image: Screenshot, De Tijd
US President Donald Trump has been adopting a series of new import tariffs — and threatening many more. After increasing tariffs on China, Mexico, and Canada, the country’s three main trading partners, Trump is also targeting Europe with new trade tariffs, and on foreign-made cars and auto parts. And he is not likely to stop there. But even then, according to De Tijd, a Brussels-based data journalism website, it will not be possible to fully erase the US trade deficit. Basically, the US imports more from abroad than it export and the report includes an interactive graph with the figures for the US exports and imports, in millions of dollars for 2024, graphs of the deficit in relation to the main partners, the type of product imported from each of them, and how the world would be affected by possible retaliatory tariffs.
75 Years of Formula 1 Racecar Evolution

Image: Screenshot, ESPN
Things have changed a lot in Formula 1 since it began in 1950, not least of which is how F1 cars look — and today they are also chock full of cutting-edge technology, better aerodynamics, more safety features, and, of course, higher speed. In this detailed visual report, ESPN celebrates the sport’s 75th anniversary by presenting its evolution through a timeline, with beautiful illustrations of some of the most iconic cars in racing history, champions of different years of the Grand Prix, and explaining the innovations of each one. The report also presented information and data on the evolution of engines, body design, and tires of F1 cars and provides an overview of the future of the sport, explaining and showing in graphs the new regulations that will be implemented starting in 2026, with new requirements such as the size and weight of cars, tire width, and the use of fully sustainable fuels.
Looking Back at Tokyo Subway Sarin Gas Attack
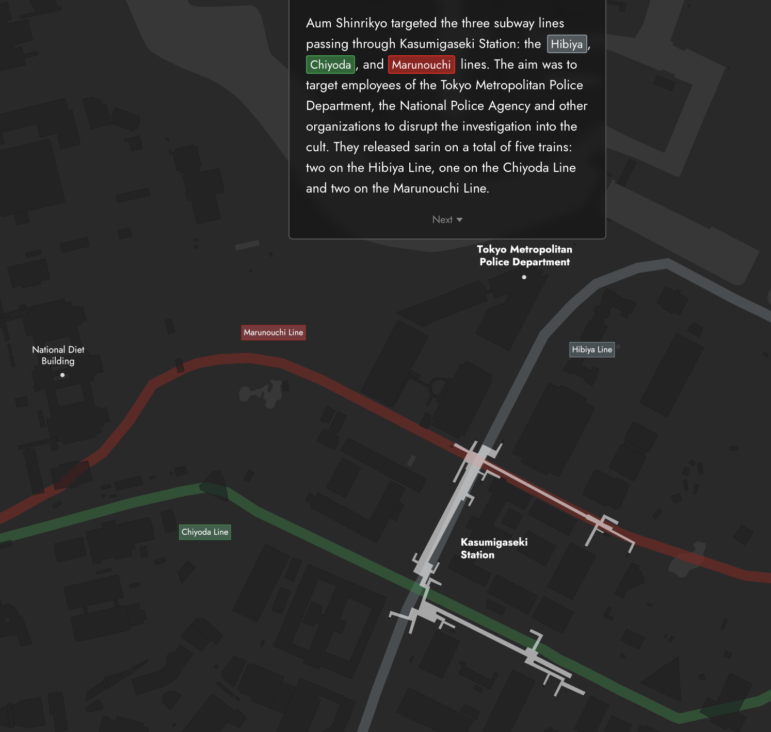
Image: Screenshot, Nikkei
On March 20, 1995, what is considered the world’s first large-scale, indiscriminate terrorist attack using chemical weapons took place. Five members of the Aum Shinrikyo cult released sarin gas, a chemical weapon with extreme nervous system potency, on separate Tokyo subway trains packed with morning commuters. Fourteen people died and more than 6,000 were injured. The attack remains the deadliest terrorist incident in Japan by modern standards. But how did it happen, what was the course of events that day, and what was the terrorists’ goal? Nikkei unraveled the incident, providing a timeline of the attack, including police audio and photographs, as well as a brief explanation of Aum Shinrikyo’s history and the group’s current status. To report on the incident, the team analyzed extensive court documents, photographs, and other records, pinpointing the exact locations and times of the events. An English version is also available.
Future of Deep Sea Mining
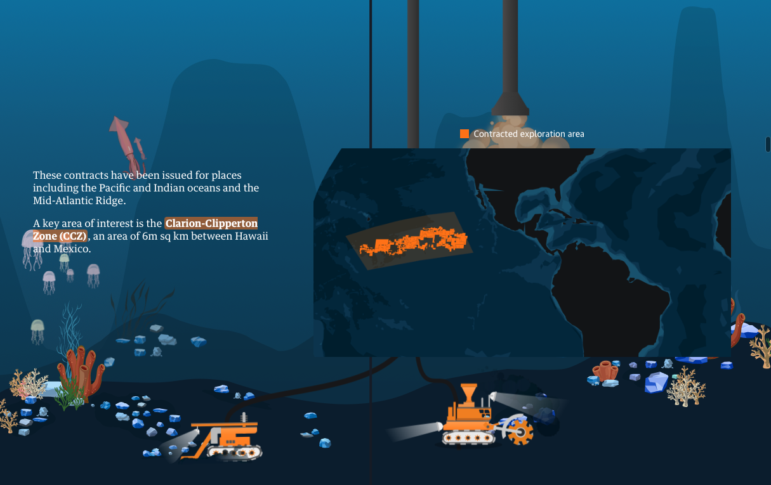
Image: Screenshot, the Guardian
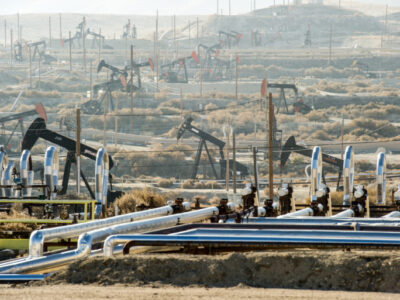
The rush for minerals, driven by the needs of sustainable energy industries, could enter a new chapter: deep-sea mining. 2025 is set to be a pivotal year for the issue. While this type of mining has been proposed for decades, mining companies now say the technology is nearly ready to make it a reality. And the international regulatory authority has a new leader promising an era of openness. In this visual explainer, The Guardian explained what we know so far about the industry, reflecting on what the environmental cost of the practice could be and whether these metals are really necessary. The report presented illustrations of how deep-sea mining works and maps of likely exploration areas – highlighting the Clarion-Clipperton Zone (CCZ), a 2.32 million-square mile area of important interest between Hawaii and Mexico, and including a map of the cetacean species sighted in the area, which could be affected by the mining noise that is expected to occur 24 hours a day at varying depths.
New Chinese Military Intimidation Tactics
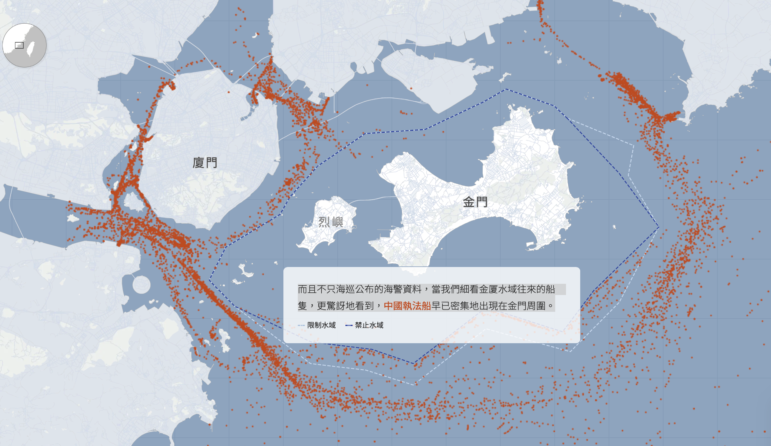
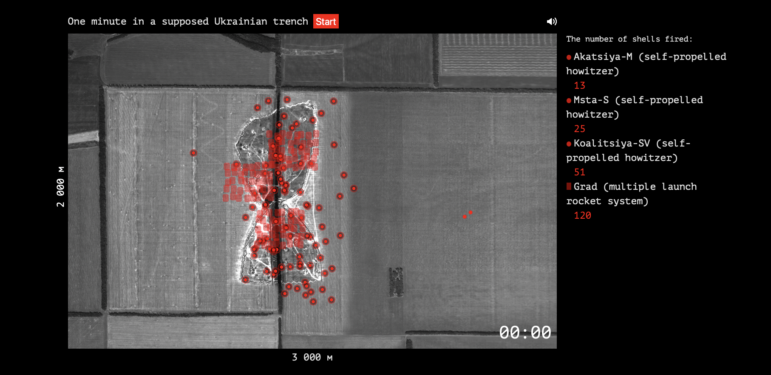
Using marine tracking data, reporters at Commonwealth magazine were able to plot the heavy traffic of Chinese law enforcement ships (red dots) around Taiwan’s Kinmen County. Image: Screenshot, Commonwealth magazine
Kinmen County, Taiwan’s closest territory to China, strategically located in the Taiwan Strait, was once the most intense frontline in the war between Taiwan and mainland China. In this visual explainer, Commonwealth Magazine showed how Kinmen has now also become China’s latest testing ground, to push the limits of its tactical incursions. The report provided a visualization of how Chinese Coast Guard vessels routinely enter Taiwan’s restricted and forbidden waters near Kinmen – 60 times last year alone – as part of China’s ongoing “gray zone operation,” with footage of one such intrusion captured by a reporter for the magazine. The team collected nearly a year’s worth of data from coast guard vessels sailing around Kinmen using Chinese Coast Guard vessel numbers and the Automatic Identification System (AIS) published by the Coast Guard Administration, and also used information from the Taiwan Coast Guard Administration to paint a realistic picture of Chinese operational patterns.
Rising Fortunes of Peruvian Politicians
Image: Screenshot, Ojoj Público
How has the wealth of Peruvian politicians increased since they took office? To answer this question, Ojo Público created an interactive platform where readers can compare the fortunes and track records of more than 150 of Peru’s most powerful politicians. This database includes President Dina Boluarte, whose net worth is 1,036 times the Peruvian minimum wage — and the site obtained details of the complaints, investigations, and legal proceedings these politicians face. The report also featured graphs showing the politicians with the greatest additional wealth since taking office. To create the datasets, the team filed freedom of information requests and collected data from public portals and tax and judicial records. According to the Peruvian investigative newsroom, Boluarte and several congressmen and regional governors have seen an increase in their fortunes that cannot be justified by the income they receive as public servants.
Ramadan Around the World
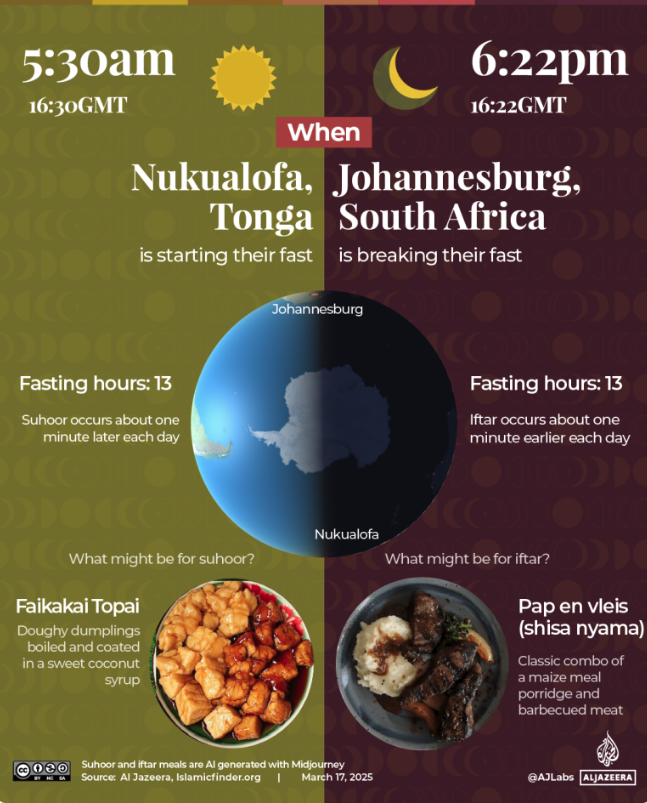
Image: Screenshot, Al Jazeera
Every year, Al Jazeera produces a data special on some aspect of Ramadan, the holy month in which Muslims around the world fast from pre-dawn to sunset. This year, the outlet put together a series of charts illustrating which cities are starting their fasts and which are ending them at the same time – due to their opposing time zones – and with typical examples from each country of what might be served for suhoor, the meal Muslims eat before sunrise, and iftar, the meal they eat at sunset to break the fast. For example, at dawn in Winnipeg, Canada, while Muslims are preparing to fast by probably eating pancakes, at that exact moment, on the opposite side of the world, the sun is setting in Jakarta, Indonesia, and families are gathering around tables to break their 13-hour fast, which might include eating bubur, a traditional rice porridge. According to the report, this contrast serves as a reminder of the global nature of Ramadan: “As the world spins, there is always a city having suhoor or iftar, with millions of Muslims experiencing these meals at different times.”
Silent War of Sabotage in the Baltic Sea
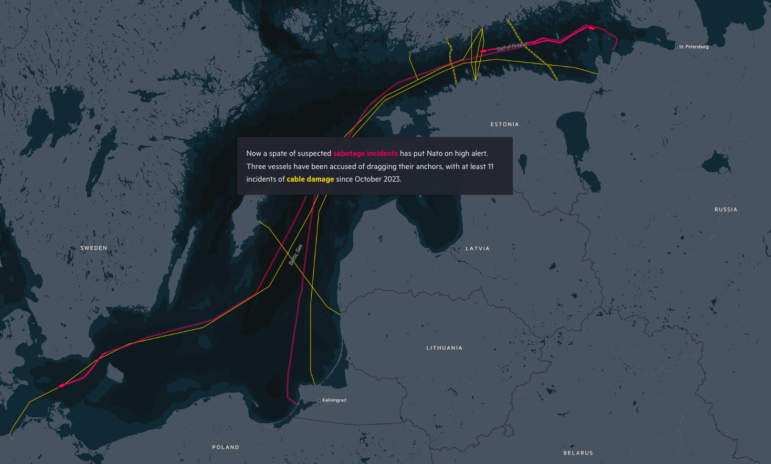
Image: Screenshot, Financial Times
As the world awaits a possible ceasefire in the three-year-old conflict between Russia and Ukraine, another region is experiencing rising tensions: the Baltic Sea. The region is a major trade corridor for Europe — where all of the countries bordering its waters are members of the North Atlantic Treaty Organization (NATO) — and Russia and a busy shipping lane. A recent series of suspected sabotage incidents has exposed the vulnerability of Europe’s undersea infrastructure — oil pipelines and power cables in the sea’s shallow waters, as well as dozens of submarine cables used for communications. According to the Financial Times, these are all attractive targets for a possible “hybrid war.” In this visual special, the newspaper provided a map of the structures in the Baltic Sea and a detailed tracking of the route of one of the vessels involved in the incidents. Since October 2023, three vessels have been accused of dragging their anchors, with at least 11 incidents of undersea cable damage. According to the report, it is not yet known who is behind the latest three incidents, but two of the vessels are believed to be Chinese, while the other is believed to be part of Russia’s shadow fleet — a group of ships used to circumvent Western sanctions on Moscow.
US Life Expectancy in Data
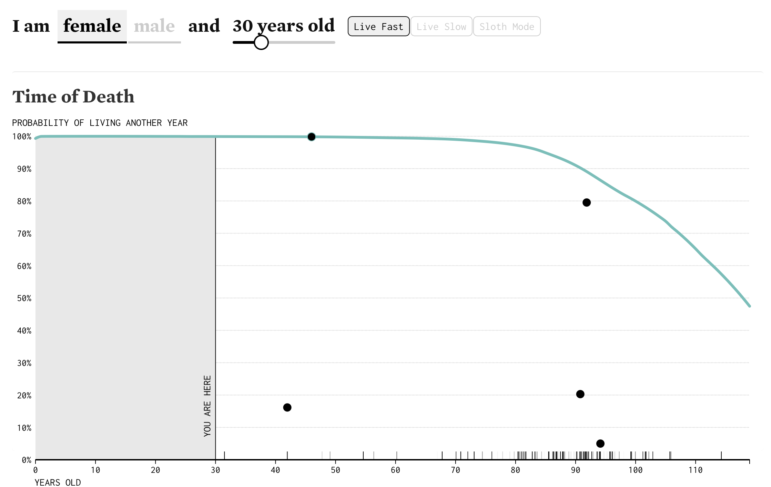
Image: Screenshot, FlowingData
We all know that we will die one day, but knowing when for each one of us is impossible, as it depends on a number of factors. In this piece, Nathan Yau of FlowingData took data from the US Social Security Administration to run simulations and obtain a more accurate and meaningful answer than the average life expectancy. Graphs of a simulated life are presented, with percentages representing the person’s chances of living until the next year, according to the age and sex entered by the reader. The numbers and statistics presented, as well as the text, change according to the data provided by the reader. The methodology for these predictions is the Markov Chain Monte Carlo (MCMC), a statistical technique for sampling data from complex distributions, in which each step in a chain of events is determined by the previous step. Obviously, the estimates won’t be accurate for everyone because life expectancy depends on so many other environmental factors and at any moment a person can fall victim to a catastrophe or a terminal illness. But for Yau, these estimates are useful for planning and making long-term life decisions.
Bonus: Information is Beautiful Awards Longlist

Image: Screenshot, Information is Beautiful Awards
Looking for inspiration for a beautiful data visualization? The Data Visualization Society recently released the longlist for the Information is Beautiful Awards, which celebrate excellence and beauty in data visualization, infographics, interactives, and information art. The shortlist is set to be announced on April 20 during a virtual awards ceremony. It’s worth checking out the nearly 1,000 nominees.